First, a disclaimer: I’m not a musician, nor do I have any formal training in music. However, I have a genuine interest in it and have been learning guitar for a few months. I might get some music-related concepts wrong, so please feel free to correct me.
What is sound anyway? #
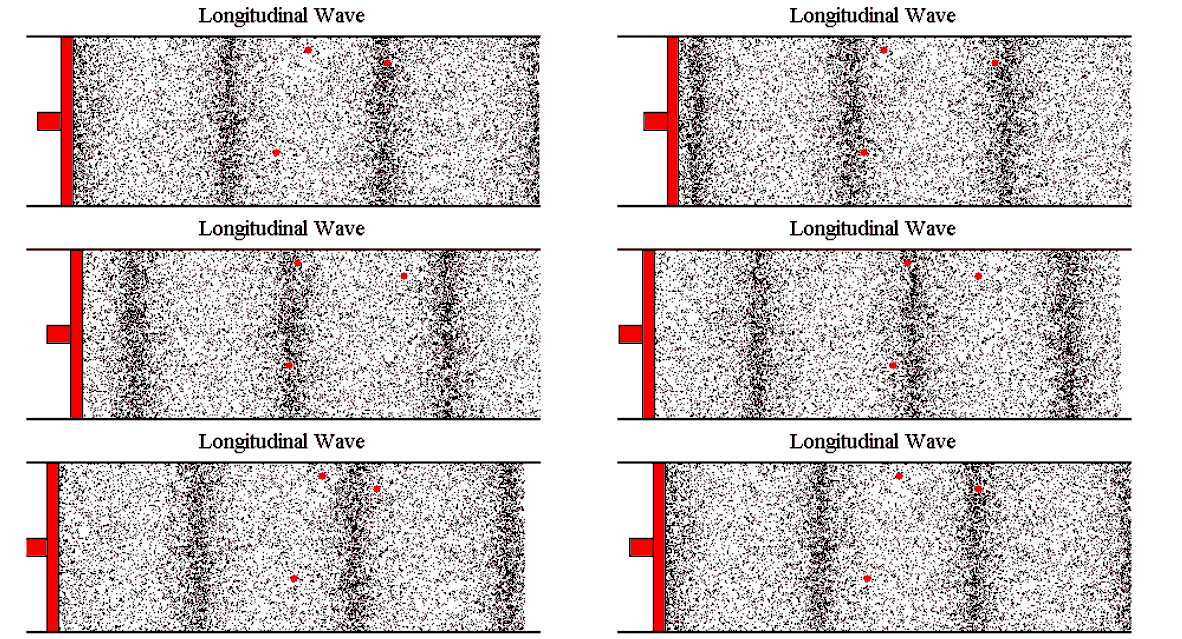
You might have learnt about sound as waves traveling through air. Air repeatedly gets compressed and expanded. Our ears perceive that as sound. 1

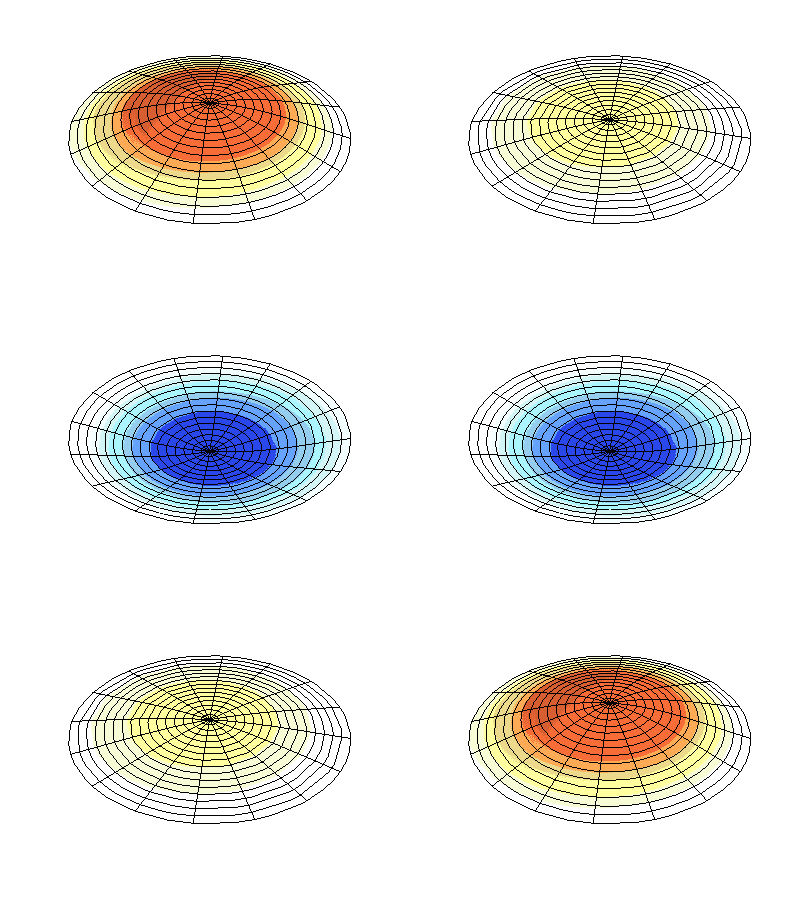
Another way to look at sound is vibration. When moving air hits the eardrum, it makes the drum vibrate and (oversimplifying it a lot) we perceive that as sound. It moves back and forth slightly from its resting position. 2

Frequencies #
Both the waves and the vibrations happen very quickly. Humans can generally Those numbers are an ideal range. As we age, that range reduces a lot. If you’re above 50, that range goes up to only 8000 or 12000Hz. 3 1 Hertz (written as 1Hz) is one back and forth movement in one second. Imagine something vibrating 20,000 times a second!
The frequency of (western) music generally ranges from 30Hz to around 4200Hz.
Low-frequency sounds are deep and thick, which is referred to as low pitch. High-frequency sounds are thin and sharp, which is known as high pitch.
However note (hehe) that a note on an instrument doesn't just consist of a single frequency.How do we represent sound as data? #
Now that we know that sound is just waves, let’s look at the simplest wave. The sine wave. It is called so because it’s the wave created by $$y = sin(x)$$
A wave has two important properties. The amplitude (A) is the maximum displacement from the reference value which, in this case, is 0. The second is frequency (f), which is how often the wave repeats and is usually measured in Hertz (Hz). For example, a sine wave of f=2Hz repeats the whole wave (from 0 to 0) twice in one second. In other words, the distance between two peaks of the wave is 1/f = 0.5 seconds.
For a sine wave with custom amplitude and frequency, the equation would be:
Actually, the equation used for the exact chart below is $$y = A \cdot sin(2\pi \cdot f \cdot x)$$ A simple sin(x) wave repeats every 2π distance on the x-axis. The multiplication by 2π ensures it repeats every 1.0 distance on the x-axis (or every 1/f distance).Here’s an interactive chart. Tweak the amplitude and frequency values below and notice the changes in the waveform.
Into a digital world #
A wave is, by definition, analog. However, in code, we only deal with the digital. The 1s and 0s. One way to go from analog to digital is by sampling. That is, checking the amplitude at regular intervals and recording it. The regular interval is called the sampling rate. Sampling never perfectly represents the source wave.
Here’s a sine wave and a sampling of it represented by dots. We can try reconstructing it by connecting the dots. As can be expected, the reconstructed wave becomes more and more accurate as we increase the sampling rate. With a high enough sample rate, the sample is close enough to the original.
Are we data yet? #
Okay, so we now have the audio as a bunch of points on a graph. To represent a point as data, we simply take its x and y-coordinates. In this case, the x-axis is time and the y is amplitude. So audio data is just a series of: $$[(t_1, a_1), (t_2, a_2), …, (t_n, a_n)]$$
Here is some of the data from the above chart, showing the sampled points.
An optimization #
You can notice a pattern in the data above. The points are always at a regular interval. So the x-values are always a multiple of some number. There are “sampling rate” number of points in one second of data. So the distance between a data point and the next is 1/(sampling rate) seconds.
This is true even in the case of real-world audio data. We can assume that the data points (the amplitudes) are always sampled at the correct interval. This means we can drop the x-values entirely. Those values can be recreated entirely using the sampling rate. So audio data now is just an array of numbers!
Now we know that audio data can be specified using two things:
- The sampling rate. The unit for this is usually Hertz (Hz) or Kilohertz (kHz).
- The amplitude of the audio at regular intervals. It’s just a list/an array of numbers.
Images - a parallel #
Let us look at something that is a little bit easier to see as data. An image. Here’s an example of a simple black & white (also called grayscale) image 4:

The resolution of this image is 256 pixels by 256 pixels. Totalling 65,536 pixels. Each pixel is represented by a number. 0 (the minimum value) is black and This depends on the bit depth of the image. The example image uses 8-bit color, hence the range of 0-255.
So to represent an image, all we need is the resolution (height, width) and a bunch of numbers. In this case, an array of 65,536 numbers.
An image can be seen as a 2-d matrix - numbers arranged in rows and columns:
$$ \begin{Bmatrix} 104 & 102 & … & 112 & 113 \\ \vdots & \vdots & \ddots & \vdots & \vdots\\ 203 & 188 & … & 179 & 172 \end{Bmatrix} $$
Color images are similar. Instead of one matrix, you have three separate ones for RGB is only one of many color models. Another way is to represent each value in the matrix as a tuple of three values (r, g, b).
Back to audio #
That digression into image as data probably raises more questions than it answers, such as: What’s the range of numbers in audio data? What’s the all black and all white of audio?
The sine wave we saw earlier will give us some hint into the range of values. Unlike images, audio data can be negative too. The zero value is the resting position of the drum or the string. The vibration happens in both directions, hence the positive and negative values.
The actual range depends on the sample’s bit depth. 16-bit audio, for example, has values in the range -32,768 to +32,767. When processing audio, the data is usually Why? I’m not sure. It may be related to the fact that audio processing usually involves a lot of addition and multiplication. With integers, you would need to handle overflows and underflows.
Black and white #
Here’s a sound sample with all zeros:
You could try increasing the volume of your speakers, but you will hear nothing. As expected, it’s silent. This is the all black of audio.
Now let’s see a sample with all maximum values (+1.0 or +32,767). Maybe lower your volume before playing.
And… nothing? Try increasing the volume. You may hear two glitches or beeps—one at the beginning and another at the end. Imagine you press a drum’s membrane and hold it there. Or pull a guitar’s string and hold it. It won’t make any sound, except at two instants—once when you press and another when you release.
This is a big difference between image and audio data. Sound is created by movement. If there’s nothing changing across time, there’s no sound. Audio is temporal. When the amplitude changes across time, like the sine wave we saw before, we get sound. A straight line is silence, no matter what amplitude it has.
In a way, a piece of music is a painting in time.
Channels #
Similar to the R, G, B-values of color images, sound too can have multiple channels. For example, most music is 2-channel. This is meant to be listened to with a pair of headphones. One channel for the left speaker and the other for the right. This is called You might have also heard of 5.1 channel audio usually in the context of movies and home theatres.
The way multi-channel audio is represented as data is similar to images. One method is to have multiple separate arrays of data—one array for each channel:
$$ Ch_1 = [Ch_1t_1,\thickspace Ch_1t_2,\thickspace Ch_1t_3,\thickspace …]\\ Ch_2 = [Ch_2t_1,\thickspace Ch_2t_2,\thickspace Ch_2t_3,\thickspace …]\\ \vdots\\ Ch_n = [Ch_nt_1,\thickspace Ch_nt_2,\thickspace Ch_nt_3,\thickspace …]\\ $$
Alternatively, we can have a single array where each time step is represented by N numbers—one for each channel—arranged sequentially: N numbers for time1, then N numbers for time2, and so on: $$ [Ch_1t_1,\thickspace Ch_2t_1,\thickspace …,\thickspace Ch_nt_1,\thickspace Ch_1t_2,\thickspace Ch_2t_2,\thickspace …,\thickspace Ch_nt_2, …] $$
Conclusion #
Putting all of that together, sound is represented using these three properties:
- The sampling rate. Example: 44.1kHz.
- The number of channels. Example: 2.
- An array of numbers representing the amplitude at regular intervals (1/(sampling rate) seconds) and for each channel.
Further reading #
What can we do with this data? Since audio is just a signal, we can use digital signal processing (DSP) algorithms on it. One such process is the Fourier Transform, which can help find out the frequencies present in the audio data. There’s a class of algorithms for efficiently calculating the fourier transform of a signal in code—the Fast Fourier Transform.
You can start playing around with audio data in code. There are libraries in most languages for reading sound from your device’s mic or by reading a wav, mp3, etc file. Here are some popular ones:
- Python:
- Libraries for audio I/O: python-sounddevice - has a simple interface for reading audio as a numpy array given the number of seconds, sample rate and number of channels.
- Libraries for audio processing: SciPy - fourier transforms.
- Rust: rust.audio is a good collection of resources. Some mentions:
- cpal - audio I/O library. This is not the simplest library to start with. It took me a while to figure out reading audio data into a Vec.
- fundsp - audio synthesis library. You can create sounds, maybe even music, with just code. I have not used it extensively—only the basics to generate test cases for audio applications.
- rustfft
-
Source of the image: Ways of showing waves by The University of Southampton ↩︎
-
Source of the image: Vibrational Modes of a Circular Membrane by Dan Russell ↩︎
-
Source: Patterns of hearing changes in women and men from denarians to nonagenarians by Wasano et al. ↩︎
-
Source: Database of test images ↩︎